News
2024 Q1 News Release: Updating Total Assets of PDBs and DFIs for the Fiscal Year 2022
A. Database update
To date, the Public Development Banks (PDBs) and Development Financing Institutions (DFIs) database includes 533 institutions from 155 countries and economies with total assets of 22.2 trillion dollars, which is the sum of the latest total asset data available from 2016 to 2022. Taking into account the institutions that do not disclose any total asset data from 2016 to 2022, we estimate that the total assets of all PDBs and DFIs are approximately 23 trillion dollars.
The total assets of PDBs and DFIs for the fiscal year (FY) 2022 have been updated during the first quarter of 2024. We collected FY 2022 total assets data for 341 of them, totaling 21.93 trillion dollars. This time we not only updated the total assets data in millions of U.S. dollars for fiscal year 2022, but also updated the total assets data in millions of presentation currency for fiscal years 2018-2022.
Our methodology for data collection merges the use of natural language processing (NLP) with hands-on data collection, all underpinned by rigorous quality control protocols. In our quest to amass publicly accessible financial data with utmost completeness and accuracy, we have executed a triple-layered quality control strategy. This strategy encompasses a preliminary cross-checking with BankFocus data, a secondary double-verification, and a conclusive assessment by researchers from the Peking University, the French Development Agency, and the Foundation for Studies and Research on International Development.
Considering the 319 institutions having available data for total assets from 2018 to 2022, the total adds up to 21.9 trillion with an annual growth rate of -2.0% compared with 2021.
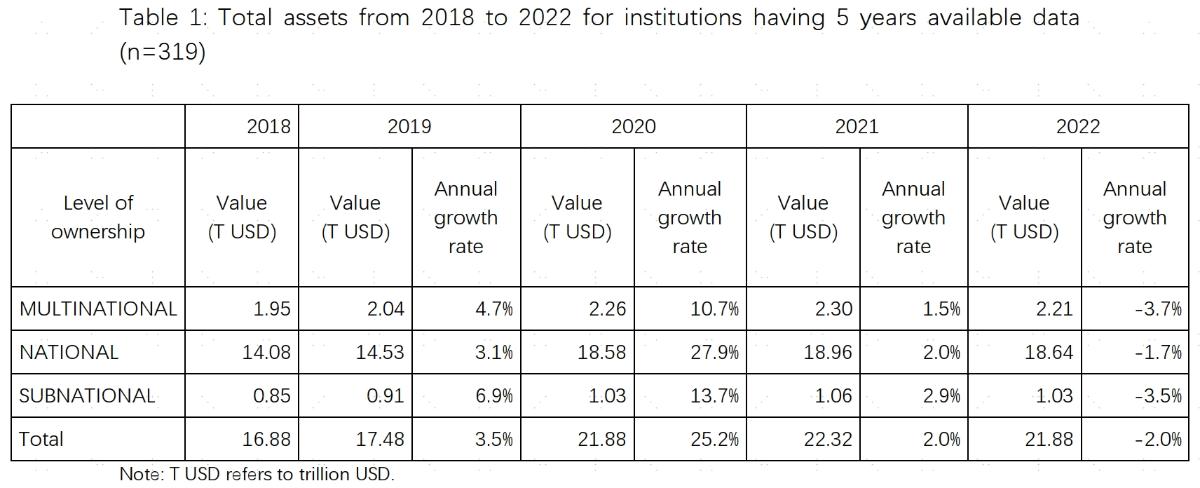
The Covid-19 pandemic dragged the global economy into a recession, however, the world’s real GDP (measured in constant 2015 prices in U.S. dollars) annual growth rate returned to its average annual rate and even exceeded it in 2021 with 6.2% and 3.1% in 2022 [1]. Conversely, the PDBs and DFIs’ total assets growth rate decreased from 2.0% in 2021 to -2.0% in 2022. In contrast to the procyclical behavior of private capital, PDBs and DFIs may play a significant countercyclical role [2] as indicated by the substantial increase in total assets in the year of 2020. The countercyclical effect may vary across different PDBs and DFIs as far as the level of ownership is concerned. According to Table 1, national PDBs and DFIs on average tend to play a stronger countercyclical role as the annual growth rate of their total assets is much larger than multilateral and subnational ones in 2020.
Our time-series data may help researchers to conduct a large-N regression analysis in the future to test whether and why PDBs and DFIs play a countercyclical role during the past 5 years scattered with the Argentina economic crisis (2018), the pandemic crisis (2019), the war in Ukraine. Even though total assets are not a direct measurement of loans provided by PDBs and DFIs, it provides a relevant proxy for a preliminary analysis. In addition, a more solid analysis needs to take into account exchange rate fluctuations and inflation. Our first-cut analysis on the size of total assets in current USD reveals an upward trend in the aggregate total assets of PDBs and DFIs, rising from 17.1 trillion dollars in 2018, 17.7 trillion dollars in 2019, to 22.1 trillion dollars in 2020, 22.5 trillion USD in 2021 and decreasing to 21.9 trillion dollars in 2022.
Note that due to modifications in the list of PDBs and DFIs and the update of total assets, the aggregate total assets for the same fiscal year may slightly differ from the previous disclosure.
Additionally, among 338 PDBs and DFIs that release the data on total assets 2021 and 2022 in our database, 170 institutions (50.3%) had an asset increase between 2021 to 2022 and 168 (49.7%) had an asset stagnation or decrease. The top 10 of institutions having the total assets highest growth rate in 2022 are as follows:

The Pak-Kuwait Investment Company does not account for more than 1% of the total assets of PDBs and DFIs but shows a total assets’ annual growth rate of 360.1% representing a total assets 4.6 times higher in 2022 than in 2021.
The top 10 of institutions having the total assets lowest growth rate in 2022 are as follows:
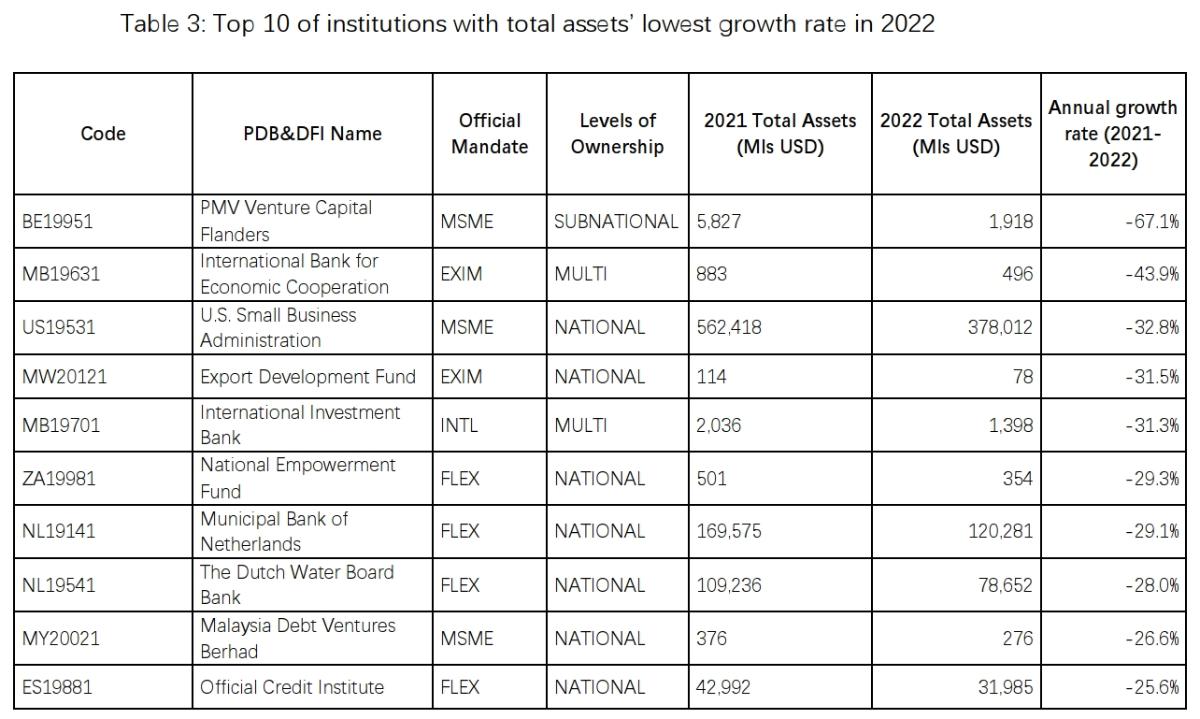
These 10 institutions show the lowest annual growth rate with negative rates. Further analysis is needed to better understand their behaviors.
B. New methodology for 2022 total assets data
To increase comparability with other databases and ensure methodological consistency, we adjusted previous data extraction methods regarding fiscal year division and exchange rate date selection for fiscal year 2022, and followed the adjusted methodology with consistent modifications to previously collected data. Please refer to the technical notes for detailed methods.
Despite these methodological adjustments, a slight difference can still be observed between the data from our database and that available on BankFocus. Overall, the total assets in presentation currency from these two sources are similar, while the main differences in total assets in USD reside in the choice of exchange rates.
Nevertheless, for some institutions, the use of different exchange rate values is not the sole reason for discrepancies observed in our database. This is the case with the World Bank Group, where the total assets collected by our team include its member institutions: the IBRD (International Bank for Reconstruction and Development) and the IDA (International Development Association). However, BankFocus publishes only data on the IBRD mentioning “World Bank, International Bank for Reconstruction and Development, BIRD IBRD”. As a result, total assets of the World Bank from our database equal to USD 537,556 million, while BankFocus reports a figure of USD 317,542 million.
Forthcoming Steps
Moving to the next stage, the database team is working on developing an automatic method using NLP to collect other financial indicators of PDBs and DFIs for the FY 2021 and 2022, including total equity, total liabilities, net income, net interest revenue, and profit before tax. Moreover, our team will update the list of institutions gathered in the database with those newly identified through our investigation.
To learn more, please visit our data visualization website (http://www.dfidatabase.pku.edu.cn/) and download the database for free. For using the information from the database, please cite: Xu, Jiajun, Régis Marodon, Xinshun Ru, Xiaomeng Ren, and Xinyue Wu. 2021. “What are Public Development Banks and Development Financing Institutions? ——Qualification Criteria, Stylized Facts and Development Trends.” China Economic Quarterly International, volume 1, issue 4: 271-294. DOI: https://doi.org/10.1016/j.ceqi.2021.10.001
Database DOI:https://doi.org/10.18170/DVN/VLG6SN
We welcome feedback from academia, policymakers, practitioners from PDBs and DFIs, and other stakeholders to provide constructive suggestions and fill gaps in the database. Please contact us at nsedfi@nsd.pku.edu.cn.
References:
1. Data from: https://data.worldbank.org/indicator/NY.GDP.MKTP.KD.ZG?end=2022&start=1961&view=chart
2. Léon F. (2020) " Are public development banks counter-cyclical? A brief", Ferdi Policy brief B212, October